International Journal of Electrical and Computer Systems (IJECS)
ISSN: 1929-2716

Volume 1, Issue 1, Year 2012 - Pages 9-17
DOI: 10.11159/ijecs.2012.002
Cluster Analysis of Center-of-Pressure Measures
Shabana Baig1, Richard M. Dansereau1, Adrian D. C. Chan1, Anthony Remaud2, Martin Bilodeau2
1Department of Systems and Computer Engineering, Carleton University
1125 Colonel by Drive, Ottawa, ON K1S 5B6 – Canada
sbaig@sce.carleton.ca; rdanse@sce.carleton.ca; adcchan@sce.carleton.ca
2School of Rehabilitation Sciences, Faculty of Health Sciences, University of Ottawa and
Bruyère Continuing Care
Élisabeth Bruyère Research Institute
43 Bruyère Street, Ottawa, ON K1N 5C8 – Canada
aremaud@bruyere.org; martin.bilodeau@uottawa.ca
Abstract - Postural stability analysis is useful in a variety of applications, such as assessing the risk of falls for older adults or investigating neuromuscular disorders. Variations in the center-of-pressure (COP) are often used to assess postural stability. The COP is a point where the vertical reaction forces of the ground act. It represents the weighted average of all pressures over the body in contact with the ground. Static posturography, which analyses COP variations during a fixed standing posture, is a non-invasive assessment technique, used to quantify postural stability. The objective of this study is to investigate the performance of six conventional COP measures used to characterize postural stability. Six conventional measures are investigated: i) average radial displacement, ii) average velocity, iii) area of the 95% confidence ellipse, iv) standard deviation of COP in the x-direction (medio-lateral), v) standard deviation of COP in the y-direction (antero-posterior), and vi) standard deviation of radial displacement. These COP measures are compared during four different stability conditions: i) feet together, eyes open, ii) feet together, eyes closed, iii) single leg, eyes open, and iv) single leg, eyes closed. Performance is quantified by cluster analysis using the silhouette coefficient, which provides a measure of how well clustered the four stability conditions are for a given stability measure. A good stability measure should have high repeatability for a given stability condition (low intra-cluster distances) and be able to discern between different stability conditions (high inter-cluster distances). Results from eight subjects suggest that out of the six COP measures examined, average velocity is the best measure to assess postural stability.
Keywords: Center-of-Pressure, Sway Path, Posturography, Postural Stability, Silhouette Coefficient
© Copyright 2012 Authors - This is an Open Access article published under the Creative Commons Attribution License terms. Unrestricted use, distribution, and reproduction in any medium are permitted, provided the original work is properly cited.
1. Introduction
Postural control refers to maintaining balance and orientation in the gravitational field, which is essential for the performance of everyday activities such as walking or reaching for objects. Postural control is a complex phenomenon where equilibrium of the body must be maintained in the gravitational field by continuous adjustments of center-of-pressure (COP) within the base support (Horak, 1987) (Dietz, 1992). The control system receives information from various afferent systems and integrates this information with the central nervous system to adjust posture and related muscle contractions (Dietz, 1992). Collins and De Luca (1993) believe that in addition to the above closed loop mechanisms; the postural control system also employs open-loop control schemes where the open loop activation signal results in small mechanical fluctuations at various joints of the body.
Postural stability depends on a multisensory system (e.g., vestibular, visual, and somatosensory), motor components of the nervous system (Massion, 1994), and the cognitive system (Askvik, 2010). When the condition of these systems change due to ageing or disease, body sway often increases, as does the activity of the muscles used to maintain postural balance (Massion, 1994). Studies have shown that postural sway for individuals after a stoke can become twice as high as their healthy aged-matched peers (Nichols, 1997). Measurements of postural stability are used to identify neuromuscular diseases (Schmit et al., 2006) and to assess the risk of falls in frail populations (Jbabdi, Boissy, & Hamel, 2008). Studies have also shown that people with neuromuscular disorder (e.g., polio survivors) demonstrate a higher frequency of falls, frequently resulting in injury and subsequent fear of falling (Bickerstaffe, Beelen, and Nollet 2010). The fear of falling is an important factor in restriction of physical activities, which results in lower income, deprivation on healthy activities and depression (Curcio, Gomez, & Reyes-Ortiz, 2009).
Thirty to sixty percent of the senior population (65 years or older) fall every year (Jbabdi et al., 2008). Consequences of falls in seniors can include an increase in mortality, decline in mobility, and other health complications that decrease quality of life and require early geriatric care (American Geriatrics Society, British Geriatrics Society, and American Academy of Orthopaedic Surgeons Panel on Falls Prevention, 2001). A fall happens when stability is adequately disturbed, and time control and muscular strength are not sufficient to recover or adapt to these perturbations. Aging affects the forces used to control posture (Mcclenaghan et al., 1996). There are many additional age-associated factors contributing to a decline in stability, such as balance or gait disorders (Lord, Menz, & Tiedemann, 2003), and cognitive impairments, particularly a misperception of orientation (Jensen, Nyberg, Gustafson, & Lundin-Olsson, 2003). Falls and fall associated fractures are the major cause of disability in seniors (Shimada et al., 2011). Early intervention can help to mitigate the risk of falling, and related health and social issues (Shimada et al., 2011). All this motivates researchers and clinicians to develop new ways to understand and quantify postural stability.
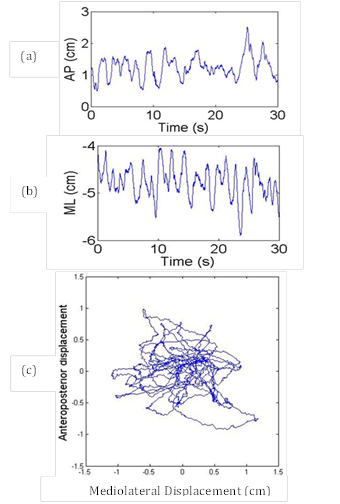
There are a number of existing methods, technical and nontechnical, for the assessment of postural stability. Nontechnical methods, such as the Berg balance scale (Berg, Maki, Williams, Holliday, & Wood-Dauphinee, 1992), the functional reach test (Duncan, Weiner, Chandler, & Studenski, 1990), and the fall risk index (Tinetti, Williams, & Mayewski, 1986), are easy to conduct and do not need expensive equipment (Browne & O'Hare, 2000a). However, these methods may not be sensitive enough to measure minor improvement or deterioration in an individual's postural stability (Browne & O'Hare, 2000a). Technical methods, such as posturographic analysis, are used to provide a quantitative assessment of postural stability and are relatively easy to conduct (Baratto, Morasso, Re, & Spada, 2002) (Browne & O'Hare, 2000a). With posturography, an individual's COP trajectory is typically recorded by using a force platform. The posturograph (see Fig. 1(c)) is a two dimensional plot of the antero-posterior (AP) (Fig. 1(a)) and medio-lateral (ML) (Fig. 1(b)) displacement of the COP (Baratto et al., 2002). The COP trajectory reflects the dynamic nature of postural control. In static posturography, the COP displacements, occurring during static posture are analyzed. Although the unperturbed upright stance position looks static, there exists a process of rocking from the ankle; this rocking or swaying is often compared with a simple inverted pendulum (Gage, Winter, Frank, & Adkin, 2004). This low-amplitude swaying can be indexed by the COP (Pellecchia & Shockley, 2005).
The dynamic nature of COP
displacements helps us to understand the inherent complexity of the postural
control system and its constituent processes (Winter, 1995). The analysis of
the COP motion gives comprehensive information of postural stability.
Conventional COP measures used to quantify postural stability include the
average radial displacement of the COP (Gosselin, Rassoulian,
& Brown, 2004), the average velocity of the COP (Gosselin et al.,
2004), area traversed by the COP (Cavalheiro, Almeida,
Pereira, & Andrade, 2009), standard deviation of the![]() (ML) ,
standard deviation of the
(ML) ,
standard deviation of the ![]() (AP) (Doyle,
Hsiao-Wecksler, Ragan, & Rosengren, 2007) (Clair & Riach, 1996) and
standard deviation of the radial COP displacement (Prieto,
Myklebust, Hoffmann, Lovett, & Myklebust, 1996). Such variables have
been shown to be sensitive to various health conditions. For example, low back
pain patients have been reported to exhibit greater COP excursions and a higher
mean velocity as compared to healthy individuals (Ruhe, Fejer, & Walker,
2011).
(AP) (Doyle,
Hsiao-Wecksler, Ragan, & Rosengren, 2007) (Clair & Riach, 1996) and
standard deviation of the radial COP displacement (Prieto,
Myklebust, Hoffmann, Lovett, & Myklebust, 1996). Such variables have
been shown to be sensitive to various health conditions. For example, low back
pain patients have been reported to exhibit greater COP excursions and a higher
mean velocity as compared to healthy individuals (Ruhe, Fejer, & Walker,
2011).
There are numerous COP measures; however it is not evident which measure is optimal (Chaudhry, Bukiet, Ji, & Findley, 2011), even if the average velocity of the COP tends to be a more sensitive measure (Raymakers, Samson, & Verhaar, 2005). A good COP measure should be able to differentiate between levels of stability, while simultaneously being repeatable for the same level of stability. In this study the performance of COP measures, in the sense of repeatability and differentiability for different levels of stability conditions, are assessed by employing cluster analysis. This work is an extension of the conference paper presented by the authors in Baig et al. (2012) with an increased experimental study and introduction of noise analysis of the experimental setup.
2. Clustering and the Silhouette Coefficient
Cluster analysis was used to quantify the performance of COP measures in the sense of repeatability and differentiability between different stability conditions. For a given subject, the repeated trials were used to form clusters of COP measures, clustered by stability condition. A good stability measure will maximize the inter-cluster distances (increased ability to differentiate between different levels of stability) and minimize the intra-cluster distances (increased repeatability for a given level of stability). To quantify the inter- and intra-cluster distances the silhouette coefficient (Rousseeuw, 1987) was used.
The
silhouette coefficient calculates the silhouette width for each sample, from
which the average silhouette width for each cluster and overall average
silhouette width for a total data set can be computed. The
silhouette coefficient for a single object ![]() is defined
as (Rousseeuw, 1987)
is defined
as (Rousseeuw, 1987)
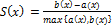
where a(x) is the average
distance of object ![]() to all other objects in the same cluster and b(x) is the average distance of object x to objects in the next nearest cluster. An average silhouette width, for
either a cluster or the total data set, can be computed as
to all other objects in the same cluster and b(x) is the average distance of object x to objects in the next nearest cluster. An average silhouette width, for
either a cluster or the total data set, can be computed as
where xi is an object being considered, i = 1, ..., M.
The silhouette coefficient S(x) lies between −1 and 1; values close to 1 indicate that clusters of COP measures are compact and well-separated for different stability conditions, whereas values that are close to −1 indicate that clusters are not well-separated and may overlap. If the value is zero then the clusters for different stability conditions will not be differentiable. Therefore, a larger silhouette coefficient suggests better performance of a COP measure.
3. Methods
3.1 Noise Analysis
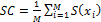
A force platform is highly susceptible to different kinds of noise; to ensure the reliability of the various measures of COP, the baseline noise and precision of the force plate were investigated. To collect the noise data, the force platform was divided into a grid of 4x4 squares. A load of 45 kg was applied on the force platform at five different positions (center c, front f, back b, right r, and left l) as shown in Fig. 2(a) with photos of each setup shown respectively in Fig. 2(b). The values of COP were calculated for 120 s of data for each position with results tabulated in Table 1. The noise in the force platform signal due to a static load on the force platform is a background measurement noise and noise induced due to the positioning of a load (or a person) on the force platform is a spatial noise (Browne & O'Hare, 2000a, 2000b). Ideally, the value of COP should be same in spite of where the subject is standing or where the load is placed on the surface of platform.
3.2 Data Acquisition
This research was reviewed and approved by the Research Ethics Boards (REB) of Bruyère Continuing Care and the University of Ottawa. Data were collected from eight subjects, five males (25, 31, 31, 33, 45 years of age) and three females (21, 25, 48 years of age). All subjects had no known postural stability problems. For each subject the data were collected in one session. Each participant performed 11 trials of each of four postural stability conditions: 1) feet together, eyes open (FT-EO), 2) feet together, eyes closed (FT-EC), 3) single leg, eyes open (SL-EO), and 4) single leg, eyes closed (SL-EC). For these two last conditions, participants used their preferred leg, i.e. the one that they felt most comfortable using when standing on a single leg. The order of the four stability conditions was randomized to create 11 sets of the four stability conditions. The order of sets was also randomized between subjects. Sixty seconds of data were recorded for each stability condition, with 60 s of rest between stability conditions. A rest of 120 s was introduced between each set of four stability conditions to avoid muscle fatigue. An Advanced Mechanical Technology, Inc. (AMTI) force platform (AccuGait System, Watertown, MA, USA) was used to record the forces and moments in the x, y, and z directions; these forces and moments were used to calculate the COP. Data were sampled at a sampling frequency of 100 Hz using a 16-bit A/D converter and were processed offline in Matlab (MathWorks Inc., Natick, MA, USA).
3.3. Data Analysis
Although
60 s of COP data were recorded, only the last 30 s of data for a given trial were
used in the analysis. Preliminary analysis of the data suggested that subjects
were still establishing their static posture during the initial 30 s. Assuming
that the data is normally distributed, the mean COP position was subtracted for
each recording, such that the resulting COP was centered at zero in both the ML
and AP directions. Six conventional measures of postural COP were computed for
this study: 1) average radial displacement (RDavg) (Gosselin
et al., 2004), 2) average velocity (Vavg) (Gosselin et
al., 2004), 3) area of the 95% confidence ellipse (![]() ) (Cavalheiro
et al., 2009), 4) standard deviation of
) (Cavalheiro
et al., 2009), 4) standard deviation of ![]() (
(![]() ), 5) standard deviation of
), 5) standard deviation of ![]() (
(![]() ) (Doyle
et al., 2007) (Clair & Riach, 1996), and 6) standard
deviation of radial displacement (
) (Doyle
et al., 2007) (Clair & Riach, 1996), and 6) standard
deviation of radial displacement (![]() , (Prieto
et al., 1996). Additional details regarding the calculation of these COP
measures are provided in the Appendix. These measures were clustered and
analyzed separately for each subject and each measure by calculating the overall
average silhouette coefficient width over 11 trials and all (four) stability
conditions to find the best measure. We define the best measure as exhibiting a
higher average silhouette coefficient, resulting in a measure that is more
repeatable within the given stability cluster and discernible between the
different stability clusters. In the statistical analysis, a repeated measures ANOVA
and post-hoc tests using the Bonferroni correction were performed for
each subject to find out whether the best selected measure was
also significantly best among the investigated measures.
, (Prieto
et al., 1996). Additional details regarding the calculation of these COP
measures are provided in the Appendix. These measures were clustered and
analyzed separately for each subject and each measure by calculating the overall
average silhouette coefficient width over 11 trials and all (four) stability
conditions to find the best measure. We define the best measure as exhibiting a
higher average silhouette coefficient, resulting in a measure that is more
repeatable within the given stability cluster and discernible between the
different stability clusters. In the statistical analysis, a repeated measures ANOVA
and post-hoc tests using the Bonferroni correction were performed for
each subject to find out whether the best selected measure was
also significantly best among the investigated measures.
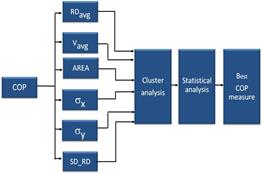
The significance level was set at 0.05. Figure 3 represents the overall methodology followed to find the best measure in the sense of repeatability and discernability. To quantify the inter- and intra-cluster distances, the silhouette coefficient (Rousseeuw, 1987) was calculated. A larger silhouette coefficient will suggest better performance of a COP measure.
4. Results
4.1 Noise Analysis
Table 1 presents the maximum COP displacement for the statically positioned test load. The maximum COP displacement recorded was 0.737 mm for the center position of the load. Differences in COPmax for the other positions were less than 0.031 mm, suggesting that spatial noise is inconsequential for the given force platform used. All other variations in the background noise are less than 0.737 mm. Thus, the results confirm that the background and spatial noises are inconsequential according to the Association Française de Posturologie (Browne & O'Hare, 2000b). Therefore, the experimental setup was verified to be suitable for COP performance analysis.
Table 1. The maximum COP values in noise measurements.
| Background Noise | Maximum Displacement (mm) | ||||
| Center | Left | Right | Front | Back | |
| COPmax | 0.737 | 0.706 | 0.736 | 0.732 | 0.726 |
4.2 Performance of COP Measures
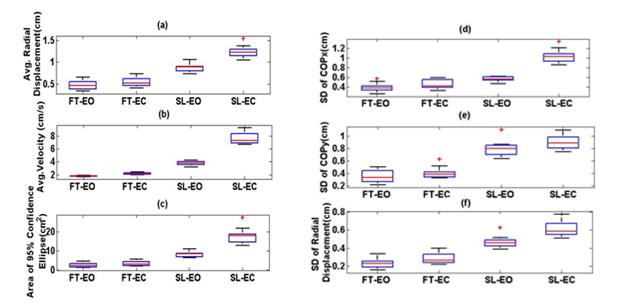
Figure 4 shows a box plot of the
clusters of COP measures for subject #2; other subjects exhibited similar behaviours.
As expected, the values of each measure increase
from FT-EO, to FT-EC, to SL-EO, to SL-EC,
suggesting a decrease in postural stability through these postures. For![]() , most
of the values in the clusters are closer to the median (i.e., they are
repeatable).
, most
of the values in the clusters are closer to the median (i.e., they are
repeatable).
 .
.
These box plots also show that the
clusters are well-separated compared to other measures. For![]() ,
clusters do not appear to overlap and are more separated than other COP
measures, suggesting that the different stability conditions are more easily
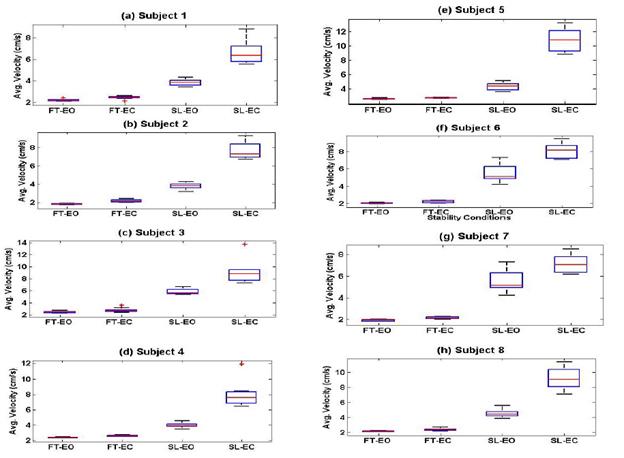
discerned. Figure 5 depicts the same performance of the average velocity for
all eight subjects where a similar level of clustering is seen for each
stability condition for all eight subjects.
,
clusters do not appear to overlap and are more separated than other COP
measures, suggesting that the different stability conditions are more easily
discerned. Figure 5 depicts the same performance of the average velocity for
all eight subjects where a similar level of clustering is seen for each
stability condition for all eight subjects.
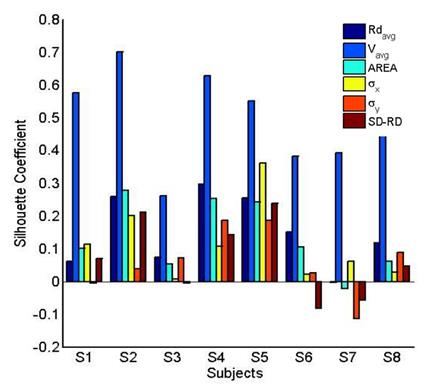
To further investigate the COP
measures, the silhouette coefficients were calculated for all subjects and for the
six COP measures; where higher values are desirable. Figure 6 shows a bar graph
of the silhouette coefficients for all COP measures, for all eight subjects. It
is clear from Fig. 6 that the silhouette coefficients for ![]() , for
all subjects, are much higher than the silhouette coefficients for other COP
measures. Many of the COP measures have negative silhouette coefficients for
some subjects, indicating that clusters overlap and are not well separated; the
smallest silhouette coefficient for
, for
all subjects, are much higher than the silhouette coefficients for other COP
measures. Many of the COP measures have negative silhouette coefficients for
some subjects, indicating that clusters overlap and are not well separated; the
smallest silhouette coefficient for ![]() is 0.28
for subject #3 from the possible range of −1
to 1.
is 0.28
for subject #3 from the possible range of −1
to 1.
Since the silhouette coefficient values for ![]() appear significantly larger than other COP measures, a statistical
analysis was performed. A repeated measure ANOVA with a single factor
was used. The significant result F(5,35)=49.69 (p < 0.001) signifies that at
least two of the silhouette coefficients are significantly
different. To find out if the silhouette coefficient for
appear significantly larger than other COP measures, a statistical
analysis was performed. A repeated measure ANOVA with a single factor
was used. The significant result F(5,35)=49.69 (p < 0.001) signifies that at
least two of the silhouette coefficients are significantly
different. To find out if the silhouette coefficient for ![]() is
significantly larger than the silhouette
coefficient for other measures, post-hoc tests using the Bonferroni
correction were conducted with results presented in Table 2.
is
significantly larger than the silhouette
coefficient for other measures, post-hoc tests using the Bonferroni
correction were conducted with results presented in Table 2.
Table 2. Pairwise comparison using Bonferroni post-hoc test.
| COP Measures Pair | Mean Difference of COP Measure Pair | Std. Error | Sig.a | 95% Confidence Interval forDifferencea | |
| Lower Bound | Upper Bound | ||||
| 0.351* | 0.039 | 0.001 | 0.182 | 0.520 | |
| 0.369* | 0.033 | <0.001 | 0.223 | 0.514 | |
| 0.390* | 0.044 | 0.001 | 0.198 | 0.582 | |
| 0.443* | 0.052 | 0.001 | 0.218 | 0.667 | |
| 0.432* | 0.032 | <0.001 | 0.293 | 0.571 | |
|
Based on estimated marginal means *. The mean difference is significant at the .05 level. a. Adjustment for multiple comparisons: Bonferroni. |
|||||
The post-hoc test revealed that
silhouette coefficients for ![]() were
significantly larger than all the compared COP measures (a = 0.05). The silhouette
coefficient for
were
significantly larger than all the compared COP measures (a = 0.05). The silhouette
coefficient for ![]() was the
largest for each subject, indicating that clusters for
was the
largest for each subject, indicating that clusters for ![]() were
well separated and compact compared to other measures.
were
well separated and compact compared to other measures.
5. Discussion
The silhouette
coefficient for ![]() was the
largest amongst the COP measures examined. This implies that clusters of
was the
largest amongst the COP measures examined. This implies that clusters of ![]() were
well separated, which specifies that the inter-cluster distances were maximum
and intra-cluster distances minimum as a whole compared to the clusters of
other COP measures examined.
were
well separated, which specifies that the inter-cluster distances were maximum
and intra-cluster distances minimum as a whole compared to the clusters of
other COP measures examined.
From Fig. 6, the values of the silhouette
coefficients for ![]() compared
to the silhouette coefficients for the other measures is clearly higher, the post
hoc test in Table 2 show that the silhouette coefficients for
compared
to the silhouette coefficients for the other measures is clearly higher, the post
hoc test in Table 2 show that the silhouette coefficients for ![]() are
significantly higher (a = 0.05). It is noted
from Fig. 6 that other measures may also allow for reasonable clustering for
some subjects, such as RDavg and
are
significantly higher (a = 0.05). It is noted
from Fig. 6 that other measures may also allow for reasonable clustering for
some subjects, such as RDavg and ![]() for
subjects #2, #4, and #5, where the silhouette coefficients approach 0.3.
However, the silhouette coefficients are lower for other subjects in this data
set. Hence, the usefulness of a particular COP measure for differentiating
between different stability conditions may be sufficient for some subjects,
but, not necessarily for all subjects. Figure 6 shows similar inconsistent
behavior for the standard deviation of
for
subjects #2, #4, and #5, where the silhouette coefficients approach 0.3.
However, the silhouette coefficients are lower for other subjects in this data
set. Hence, the usefulness of a particular COP measure for differentiating
between different stability conditions may be sufficient for some subjects,
but, not necessarily for all subjects. Figure 6 shows similar inconsistent
behavior for the standard deviation of ![]() (
(![]() ), standard deviation of
), standard deviation of ![]() (
(![]() ), and standard
deviation of radial displacement
), and standard
deviation of radial displacement ![]() .
.
6. Conclusion
The
outcome of cluster analysis using the silhouette coefficient
suggests that ![]() is the best measure compared to other
investigated conventional measures. The higher values of
silhouette coefficients for
is the best measure compared to other
investigated conventional measures. The higher values of
silhouette coefficients for ![]() indicate
that
indicate
that![]() for a
given stability condition, are more repeatable (less variable) between trials
from a data collection session, and more discernible between the different
stability conditions. At the same time, this parameter can differentiate
between different levels of stability conditions. Moreover, this study showed
that cluster analysis provides a useful quantitative approach to compare the
performance of different COP measures in different stability conditions.
for a
given stability condition, are more repeatable (less variable) between trials
from a data collection session, and more discernible between the different
stability conditions. At the same time, this parameter can differentiate
between different levels of stability conditions. Moreover, this study showed
that cluster analysis provides a useful quantitative approach to compare the
performance of different COP measures in different stability conditions.
These findings can assist in guiding future research to develop more strategies for early detection of instability in order to reduce the risk of falls in seniors and also individuals with balance disorders due to pathologies.
In this study, the performance of the six conventional measures are presented. There are other COP measures. More recent COP measures include approximate entropy (Cavanaugh et al., 2005), sample entropy (Donker et al., 2007), and the Lyapunov exponent (Donker et al., 2007). The approximate (Cavanaugh et al., 2005) and sample entropy (Donker et al., 2007) are used to measure the regularities of the time series and largest Lyapunov exponent (Donker et al., 2007) is a measure of local stability of a dynamical system. It is not evident which of these measures may have better clustering performance. Additional research is required to explore other measures that are reliable and useful for diagnostic purposes. The work presented here provides a strategy to quantitatively compare the performance of different COP measures and could be expanded to include other measures.
7. Appendix
7.1. Measures of COP
Define ![]() and
and ![]() as the zero-mean
values of
as the zero-mean
values of ![]() and
and![]() for
sample
for
sample![]() (the
means of
(the
means of ![]() and
and![]() subtracted
accordingly). Define N as the total number of samples.
subtracted
accordingly). Define N as the total number of samples.
Average Radial Displacement:
The average radial displacement of the COP,![]() , is
computed as
, is
computed as

where ![]() ;
radial displacement for ith sample.
;
radial displacement for ith sample.
Average Velocity: The average velocity of the COP, ![]() , is computed as
, is computed as

where ![]() and
and ![]() with
with ![]() the
sampling frequency.
the
sampling frequency.
Area of 95% Ellipse of COP:
The area of the 95% ellipse of COP, ![]() , is computed as (Schmit et al., 2006).
, is computed as (Schmit et al., 2006).

where F =
3.00 from the table of F statistics at a confidence level of 1 – α with
α = 0.05 when the sample size > 120. Also, the correlation coefficient between
![]() and
and ![]() is
given as
is
given as ![]() .
.
Standard Deviation of ![]() (ML):
The standard deviation of
(ML):
The standard deviation of![]() ,
,![]() , is
calculated as
, is
calculated as
Standard Deviation of ![]() (AP):
The standard deviation of
(AP):
The standard deviation of![]() ,
, ![]() , is
calculated as
, is
calculated as
Standard Deviation of Radial
Displacement: The standard deviation of radial displacement, ![]() , is
calculated as
, is
calculated as
References
American Geriatrics Society, British Geriatrics Society, and American Academy of Orthopaedic Surgeons Panel on Falls Prevention. (2001). Guideline for the Prevention of Falls in Older Persons. Journal of the American Geriatrics Society, 49(5), 664-672. View Article
American Geriatrics Society. (2001). Guideline for the Prevention of Falls in Older Persons. Journal of the American Geriatrics Society, 49(5), 664–672. View Article
Askvik, B. (2010). Effects of exercise in elderly women with osteopenia or osteoporosis. Master Thesis in Sport Sciences, Department of Sports Medicine, Norwegian School of Sports Sciences. View Article
Baratto, L., Morasso, P. G., Re, C., Spada, G. (2002). A new look at posturographic analysis in the clinical context: sway-density versus other parameterization techniques. Motor control, 6(3), 246-70. View Article
Berg, K. O., Maki, B. E., Williams, J. I., Holliday, P. J., Wood-Dauphinee, S. L. (1992). Clinical and laboratory measures of postural balance in an elderly population. Archives of physical medicine and rehabilitation, 73(11), 1073–80. View Article
Bickerstaffe, A., Beelen, A., Nollet, F. (2010). Circumstances and consequences of falls in polio survivors. Journal of rehabilitation medicine, 42(10), 908–15. View Article
Browne, J., O'Hare, N. (2000a). Development of a novel method for assessing balance: the quantitative posturography system. Physiological measurement, 21(4), 525–34. View Article
Browne, J., O'Hare, N. (2000b). A quality control procedure for force platforms. Physiological measurement, 21, 515–524. View Article
Cavalheiro, G. L., Almeida, M. F. S., Pereira, A. A., Andrade, A. O. (2009). Study of age-related changes in postural control during quiet standing through linear discriminant analysis. BioMedical Engineering onLine, 8, 35. View Article
Cavanaugh, J. T., Guskiewicz, K. M., Giuliani, C., Marshall, S., Mercer, V., Stergiou, N. (2005). Detecting altered postural control after cerebral concussion in athletes with normal postural stability. British journal of sports medicine, 39(11), 805–811. View Article
Chaudhry, H., Bukiet, B., Ji, Z., Findley, T. (2011). Measurement of balance in computer posturography: Comparison of methods--A brief review. Journal of bodywork and movement therapies, 15(1), 82-91. Elsevier Ltd. View Article
Clair, K. L., Riach, C. (1996). Postural stability measures: what to measure and for how long. Clinical biomechanics, II(3), 176–178. View Article
Curcio, C.-L., Gomez, F., Reyes-Ortiz, C. A. (2009). Activity restriction related to fear of falling among older people in the Colombian Andes mountains: are functional or psychosocial risk factors more important? Journal of Aging and Health, 21(3), 460–79. View Article
Dietz, V. (1992). Human neuronal control of automatic functional movements: interaction between central programs and afferent input. Physiological reviews, 72(1), 33-69. View Article
Donker, S. F., Roerdink, M., Greven, A. J., Beek, P. J. (2007). Regularity of center-of-pressure trajectories depends on the amount of attention invested in postural control. Experimental brain research. Experimentelle Hirnforschung. Expérimentation cérébrale, 181(1), 1-11. View Article
Doyle, R. J., Hsiao-Wecksler, E. T., Ragan, B. G., Rosengren, K. S. (2007). Generalizability of center of pressure measures of quiet standing. Gait & posture, 25(2), 166–171. View Article
Duncan, P. W., Weiner, D. K., Chandler, J., Studenski, S. (1990). Functional reach: a new clinical measure of balance. Journal of gerontology, 45(6), M192-7. View Article
Gage, W. H., Winter, D. A., Frank, J. S., Adkin, A. L. (2004). Kinematic and kinetic validity of the inverted pendulum model in quiet standing. Gait & posture, 19(2), 124–32. View Article
Gosselin, G., Rassoulian, H., Brown, I. (2004). Effects of neck extensor muscles fatigue on balance. Clinical biomechanics (Bristol, Avon), 19(5), 473–9. View Article
Horak, F. B. (1987). Clinical measurement of postural control in adults. Physical therapy, 67(12), 1881–5. View Article
Jbabdi, M., Boissy, P., Hamel, M. (2008). Assessing control of postural stability in community-living older adults using performance-based limits of stability. BMC geriatrics, 8, 8. View Article
Jensen, J., Nyberg, L., Gustafson, Y., Lundin-Olsson, L. (2003). Fall and injury prevention in residential care--effects in residents with higher and lower levels of cognition. Journal of the American Geriatrics Society, 51(5), 627–35. View Article
Lord, S. R., Menz, H. B., Tiedemann, A. (2003). A physiological profile approach to falls risk assessment and prevention. Physical therapy, 83(3), 237–52. View Article
Massion, J. (1994). Postural control system. Current opinion in neurobiology, 4(6), 877–87. View Article
Mcclenaghan, B., Williams, H. G., Dickerson, J., Dowda, M., Thombs, L., Eleazer, P. (1996). Spectral characteristics of aging postural control. Gait & posture, 4, 112–121. View Article
Nichols, D. S. (1997). Balance retraining after stroke using force platform biofeedback. Physical therapy, 77(5), 553–8. View Article
Pellecchia, G. L., Shockley, K. (2005). Application of Recurrence Quantification Analysis: Influence of Cognitive Activity on Postural Fluctuations. In M. A. Riley & G. C. Van Orden (Eds.), Tutorials in contemporary nonlinear methods for the behavioral sciences (pp. 95–141). View Article
Prieto, T. E., Myklebust, J. B., Hoffmann, R. G., Lovett, E. G., Myklebust, B. M. (1996). Measures of postural steadiness: differences between healthy young and elderly adults. IEEE transactions on bio-medical engineering, 43(9), 956–66. View Article
Raymakers, J. a, Samson, M. M., Verhaar, H. J. J. (2005). The assessment of body sway and the choice of the stability parameter(s). Gait & posture, 21(1), 48-58. View Article
Rousseeuw, P. J. (1987). Silhouettes: a graphical aid to the interpretation and validation of cluster analysis.pdf. Journal of Computational and Applied Mathematics, 20, 53–65. View Article
Ruhe, A., Fejer, R., Walker, B. (2011). Center of pressure excursion as a measure of balance performance in patients with non-specific low back pain compared to healthy controls: a systematic review of the literature. European spine journal : official publication of the European Spine Society, the European Spinal Deformity Society, and the European Section of the Cervical Spine Research Society, 20(3), 358-68. View Article
Schmit, J. M., Riley, M. a, Dalvi, A., Sahay, A., Shear, P. K., Shockley, K. D., Pun, R. Y. K. (2006). Deterministic center of pressure patterns characterize postural instability in Parkinson's disease. Experimental brain research, 168(3), 357–367. View Article
Shimada, H., Suzukawa, M., Ishizaki, T., Kobayashi, K., Kim, H., Suzuki, T. (2011). Relationship between subjective fall risk assessment and falls and fall-related fractures in frail elderly people. BMC geriatrics, 11(1), 40. BioMed Central Ltd. View Article
Tinetti, M. E., Williams, T. F., Mayewski, R. (1986). Fall risk index for elderly patients based on number of chronic disabilities. The American journal of medicine, 80(3), 429–34. View Article
Winter, D. A. (1995). Human balance and posture control during standing and walking. Gait & posture, 3, 193–214. View Article